
To help you choose a Master Trader, Bybit provides you with detailed trading performance data of each Master Trader as a reference. In addition to viewing the basic performance data of all Master Traders under the Top Master Traders and All Master Traders sections on the Copy Trading page, you can also click on a Master Trader's card to access the portfolio page to view more comprehensive trading performance data.
In this article, we will take a closer look at what the trading performance data on a Master Trader's portfolio page represents. To learn more about how Master Traders can be ranked on the Top Master Traders Leaderboard, please visit here.
Portfolio Page
There are multiple sections on the Master Trader profile page, including Performance Overview, Profit (Follower), Statistics, Statistics of Copied Trades and Follower(s).
Before we look at more detailed data, you can see the following data at the top of the page:
Performance Overview
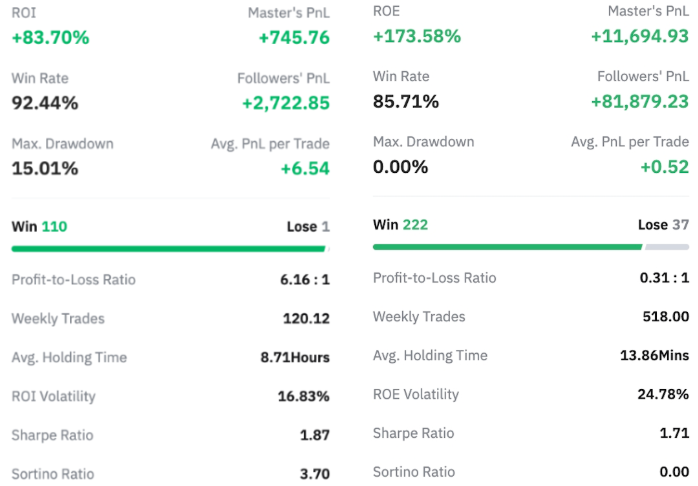
The following data can be viewed in the Performance Overview section:
How to Calculate N-day ROI
Example
On Jan 8, 2023, Trader B’s unrealized profit and loss (UPL) is +2,300 USDT, and the trading results for the past seven (7) days are as follows:
Realized P&L | Funding Fee | Trading Fee |
8,000 | 300 | 400 |
On Jan 1, 2023, Trader B’s UTA account had the following assets, along with an UPL of +1,200 USDT:
Coin | BTC | ETH | USDT |
Price | 27,000 | 1,500 | 1 |
Amount | 1 | 10 | 9,000 |
In the past seven (7) days, the following transfer activities have taken place via UTA:
Coin | BTC | LTC | LTC |
Type | Transfer In | Transfer In | Transfer Out |
Amount | 2 | 120 | 70 |
Prices at the time of the transactions | 28,000 | 75 | 85 |
The calculation for Trader B’s 7D ROI is as follows:
Previous Account Equity = 27,000 × 1 + 1,500 × 10 + 9,000 + 1,200 = 52,200
New Deposit = 28,000 × 2 + 75 × 120 = 65,000
Profit = 8,000 - 300 − 400 + 2,300 − 1,200 = 8,400
ROI = 8,400 / (52,200 + 65,000) = 7.17%
How to Calculate N-day ROE
Example
On Jan 8, 2023, Trader B’s unrealized profit and loss (UPL) is +2,300 USDT, and the trading results for the past seven (7) days are as follows:
On Jan 1, 2026, Trader B’s account had a starting UPL of +1,200 USDT.
The calculation for Trader B’s 7D ROE is as follows:
Net Realized = 8,000 - 300 - 400 = 7,300
UPL Change = 2,300 - 1,200 = 1,100
Total Income = 7,300 + 1,100 = 8,400 USDT
Weighted Average Daily Assets = 185,500,000 / 35,000 = 5,300 USDT
ROE = 8,400 / 5,300 = 158.49%
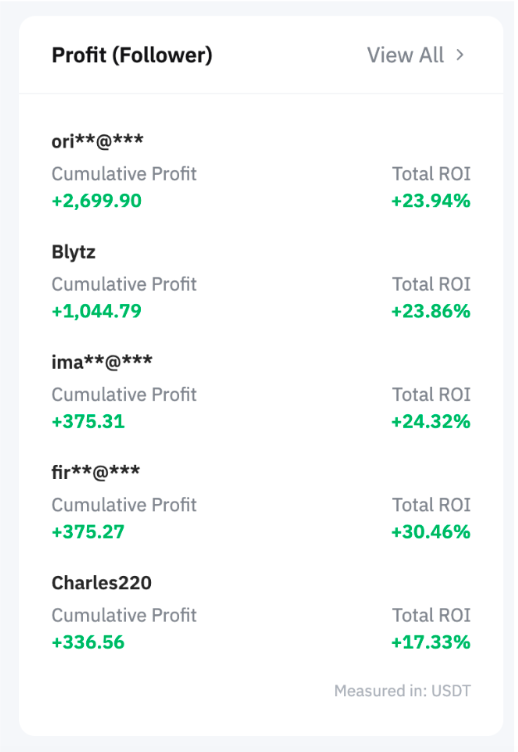
Profit (Follower)
Once a Follower starts following the Master Trader, their performance will be displayed under this section in real-time. The Cumulative Profit and Total ROI will be updated at 12 AM (midnight) every day.
Statistics
Under the Statistics tab, there are options to select — All Trades
- Trades encompasses trade data, including information on current trades and closed trades.
Three (3) types of data are provided here, including Earnings, Profit and Trading History.
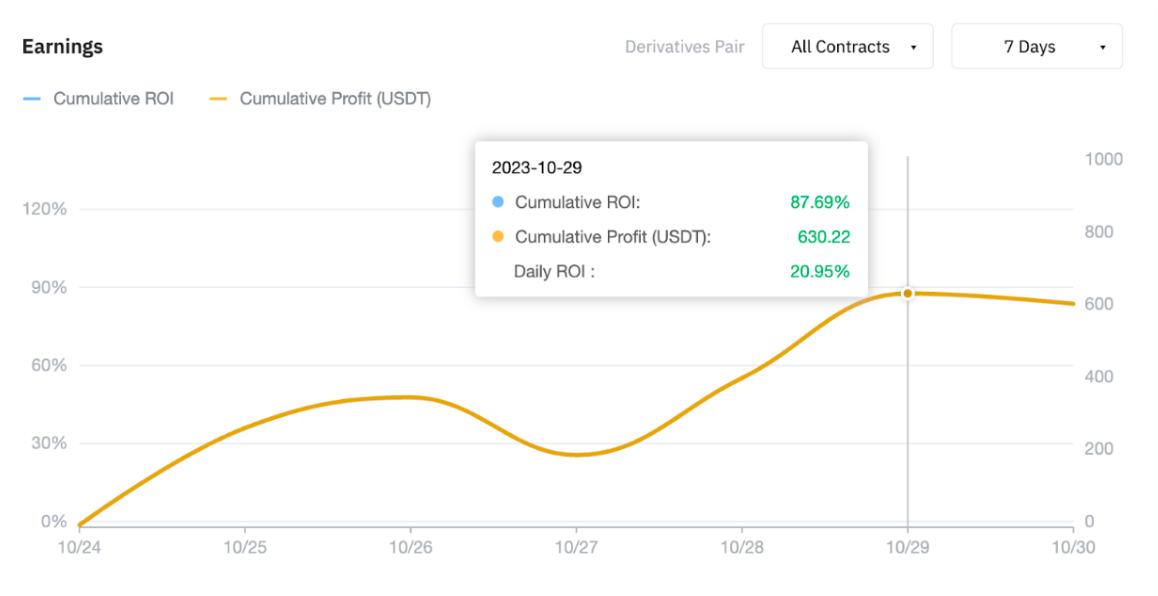
Earnings
Definition | Update Frequency | |
Cumulative ROI | Refer to the calculation method detailed in the ROI calculation under the Performance Overview shown above, which follows the same approach. | 12 AM (midnight) UTC Daily |
Cumulative Profit (USDT) | Cumulative Realized P&L + Unrealized P&L for the position held in USDT Perpetual Trades | |
Daily ROI | Refer to the calculation method detailed in the ROI calculation under the Performance Overview shown above, which follows the same approach. |
Please note that the charts for Cumulative ROI and Cumulative Profit are updated hourly.
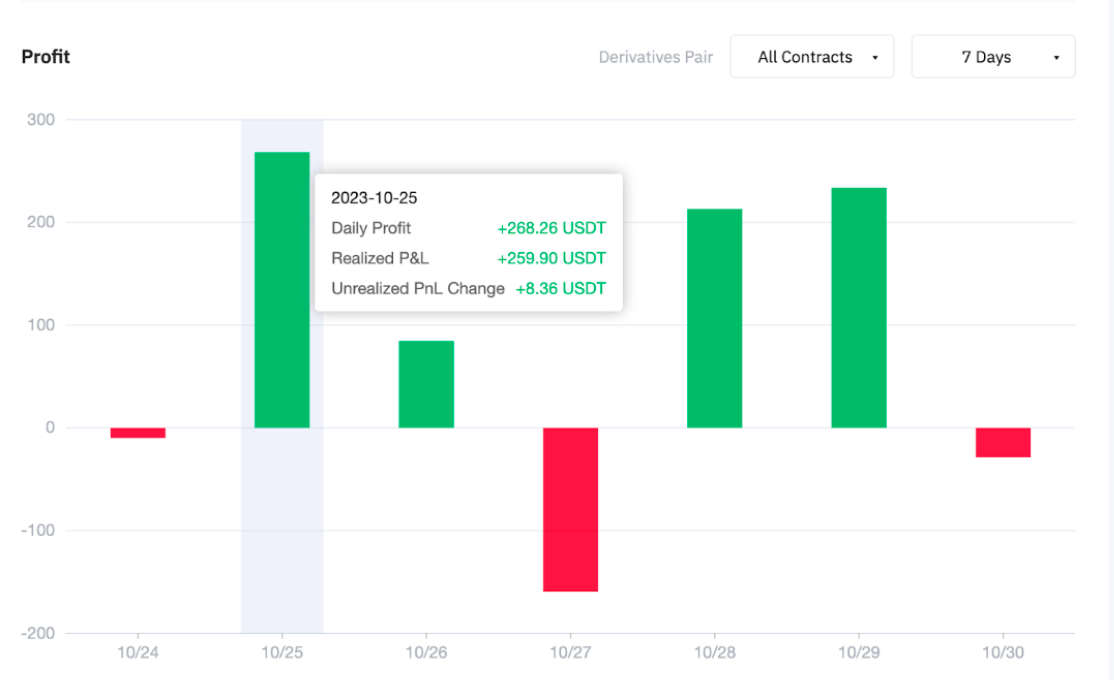
Profit
Definition | Update Frequency | |
Daily Profit | Daily Realized P&L + Unrealized P&L Change | 12AM (midnight) UTC Daily |
Trading History
Pair/% of the Total Trades, Total No. of Trades and P&L under Trading History will be updated at 12AM (midnight) daily. In addition, every transaction initiated by the Master Trader will be displayed under this section in real time. Please note that only Trading History of USDT Perpetual will be displayed here.
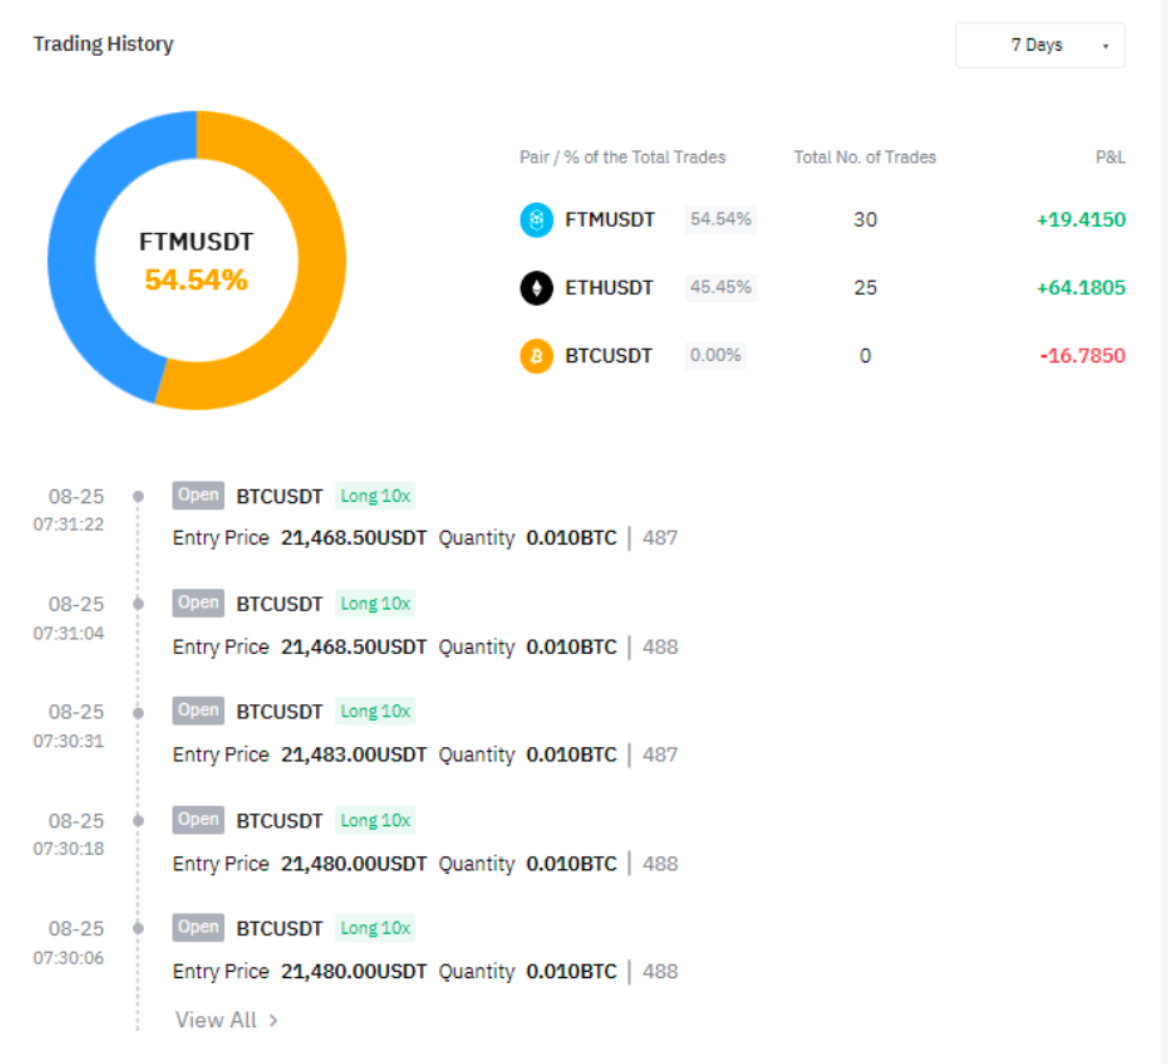
Definition | Update Frequency | |
Pair/% of the Total Trades | No. of Trades of the Respective Contracts / Total No. of Trades in N days. | 12 AM (midnight) UTC Daily |
Total No. of Trades | Total No. of positions a Master Trader has opened in N days. | |
P&L | The total profit and loss of all the closed positions for the respective symbol in N days. |
Trades
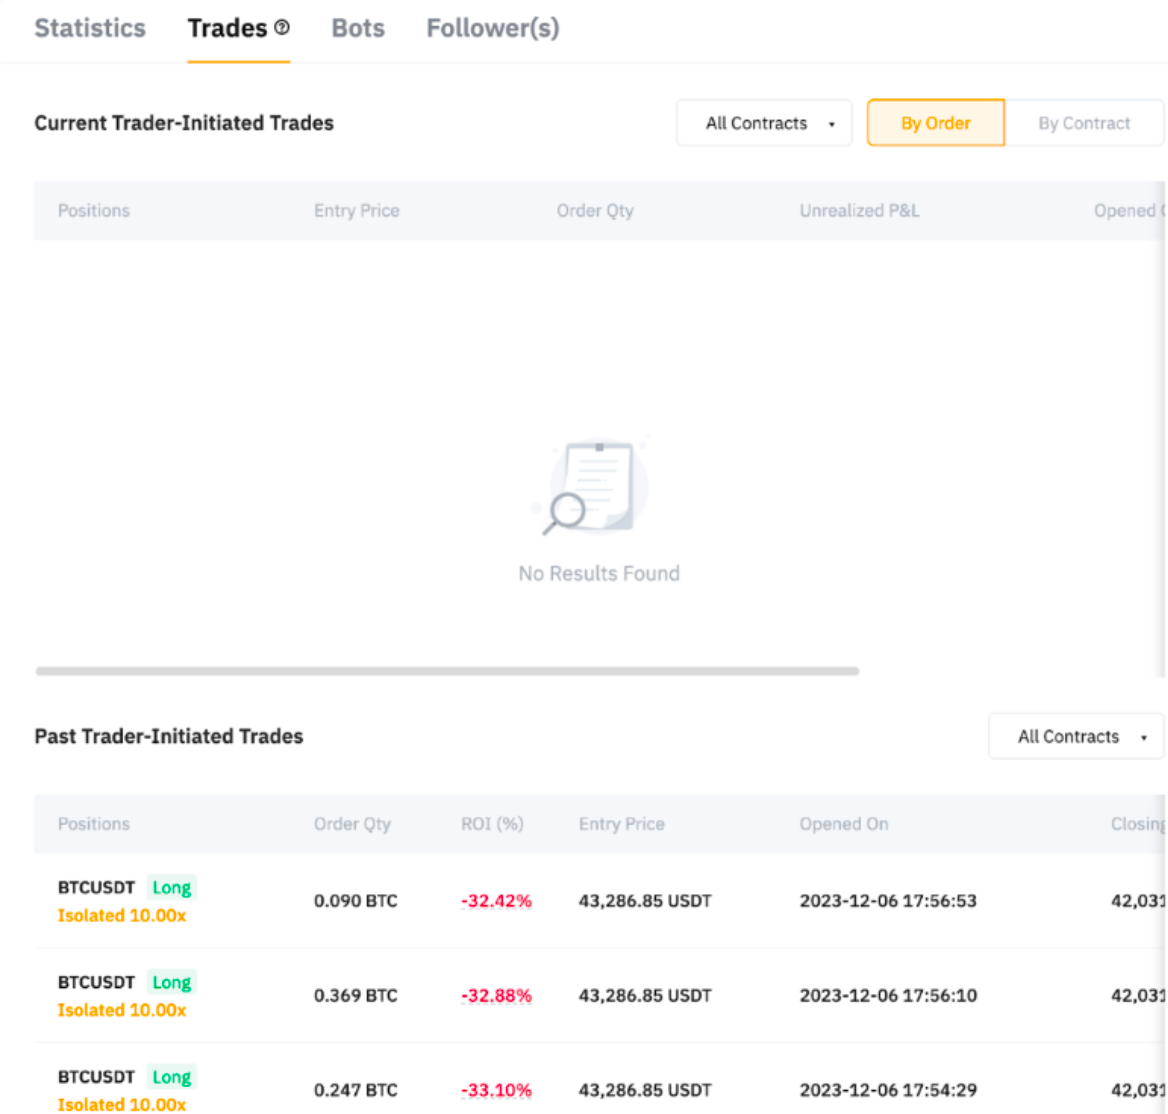
You can access details on both current and past trades under USDT Perpetual Trades. The specific data that can be viewed is as follows:
Current Trader-Initiated Trades: Positions, Entry Price, Margin, Order Qty, Opened On, TP/SL, and Unrealized P&L.
Past Trader-Initiated Trades: Positions, Order Qty, Entry Price, Opened On, Closing Price, Closed On, Margin, ROI (%) and Follower(s).
Please note that Followers' positions may not always match with your Master Traders due to several reasons. For more information, please refer to here.
Follower(s)
In this section, you can view details of the Master Trader's Followers:
Definition | Update Frequency | |
User ID | − | − |
Cumulative Cost | The cumulative margin required to copy trades initiated by this Master Trader. | 12AM (midnight) UTC the next day |
Total Profit Received | The total profit earned from copy trades initiated by this Master Trader. | 12AM (midnight) UTC the next day |
Total ROI (Follower) | The total profit from copy trades initiated by the Master Trader/The cumulative margin required to copy these trades | 12AM (midnight) UTC the next day |
Days of Following | The number of days since you followed this Master Trader. | 12AM (midnight) UTC Daily |
Disclaimer:
Past performance of Master Traders is not a guarantee of future returns. It is essential for traders to acknowledge that all investments carry inherent risks before engaging in Copy Trading. Users must assume full responsibility for comprehending and accepting these risks prior to commencing any trading activities.